How To Calculate CAGR In Excel Step By Step
How To Calculate CAGR In Excel Step By Step - There are a lot of affordable templates out there, but it can be easy to feel like a lot of the best cost a amount of money, require best special design template. Making the best template format choice is way to your template success. And if at this time you are looking for information and ideas regarding the How To Calculate CAGR In Excel Step By Step then, you are in the perfect place. Get this How To Calculate CAGR In Excel Step By Step for free here. We hope this post How To Calculate CAGR In Excel Step By Step inspired you and help you what you are looking for.
Calculating CAGR in Excel: A Step-by-Step Guide
The Compound Annual Growth Rate (CAGR) is a crucial financial metric that calculates the average annual growth rate of an investment over a specified period, assuming profits are reinvested during the term. It’s a valuable tool for comparing different investments or evaluating the past performance of a single investment. While complex financial software exists, Excel provides a simple and accessible platform for calculating CAGR. This guide breaks down the process into easy-to-follow steps.
Understanding the Formula
Before we dive into Excel, it’s important to understand the formula behind CAGR:
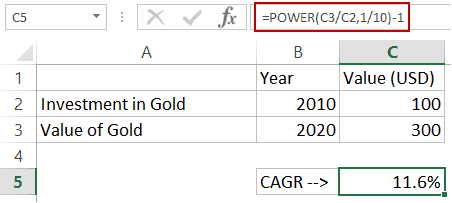
CAGR = (Ending Value / Beginning Value)^(1 / Number of Years) – 1
Where:
- Ending Value: The value of the investment at the end of the period.
- Beginning Value: The initial value of the investment at the start of the period.
- Number of Years: The total number of years the investment covers.
The “^” symbol denotes exponentiation, which is raising a number to a power. The result is a decimal, which needs to be formatted as a percentage to express the CAGR.
Step-by-Step Guide to Calculating CAGR in Excel
- Open Microsoft Excel: Launch Microsoft Excel on your computer.
- Set up Your Data: In your Excel sheet, organize your data into columns. You’ll need at least three columns:
- Year: List each year of the investment period in this column. For example, 2018, 2019, 2020, etc.
- Beginning Value: Enter the initial value of the investment for each year. In the first year of the period this will be the initial investment.
- Ending Value: Enter the value of the investment at the end of each corresponding year.
For example:
Year Beginning Value Ending Value 2018 $10,000 $11,000 2019 $11,000 $12,500 2020 $12,500 $14,000 2021 $14,000 $15,500 2022 $15,500 $17,000 - Identify the Beginning and Ending Values for the Entire Period: Determine the beginning value from the *first* year in your data set. In our example, it’s $10,000. Identify the ending value from the *last* year in your data set. In our example, it’s $17,000.
- Determine the Number of Years: Calculate the total number of years the investment period spans. In our example, the investment period is from 2018 to 2022, which is 5 years.
- Enter the CAGR Formula: Choose an empty cell in your Excel sheet where you want to display the calculated CAGR. Enter the following formula into the cell, replacing the cell references with the actual cells containing your ending value, beginning value, and number of years:
=((Ending Value Cell / Beginning Value Cell)^(1 / Number of Years)) - 1Using our example data, if the ending value ($17,000) is in cell C7, the beginning value ($10,000) is in cell B3, and the number of years (5) is in cell E3 (we will enter 5 in E3 in the next step), the formula would be:
=((C7/B3)^(1/E3))-1 - Input the Number of Years: Make sure that the cell being referenced for ‘Number of Years’ in your formula actually contains the numerical value representing the length of the investment period. In our example, if we were using cell E3, we would type “5” into cell E3.
- Format the Result as a Percentage: After entering the formula, the cell will display a decimal number. To format it as a percentage, select the cell containing the CAGR result.
- Go to the “Home” tab in the Excel ribbon.
- In the “Number” group, click the percentage (%) icon. This will display the result as a percentage.
- You can further refine the display by increasing or decreasing the number of decimal places using the “Increase Decimal” or “Decrease Decimal” buttons next to the percentage icon.
- Interpreting the CAGR: The resulting percentage represents the average annual growth rate of your investment over the specified period. For instance, a CAGR of 11.25% means that, on average, your investment grew by 11.25% each year during that time, assuming that any profits were reinvested.
Example Calculation
Let’s illustrate with our example data:
- Beginning Value (2018): $10,000
- Ending Value (2022): $17,000
- Number of Years: 5
The formula in Excel would be: =((17000/10000)^(1/5))-1
The result, after formatting as a percentage, will be approximately 11.25%.
Important Considerations
- CAGR is an Average: Keep in mind that CAGR is an *average* growth rate. It doesn’t reflect the actual year-to-year fluctuations in the investment’s value. Some years may have had higher growth, while others might have seen lower growth or even losses.
- Reinvestment Assumption: CAGR assumes that all profits are reinvested. If profits are withdrawn, the actual growth rate will differ.
- Starting and Ending Points: CAGR is highly sensitive to the starting and ending points of the period. Choosing different start and end dates can significantly alter the calculated CAGR.
- Negative Values: The formula works with negative values, but the interpretation requires careful consideration. A negative CAGR indicates an average annual decline in value.
- Error Handling: When calculating CAGR in Excel, ensure that you’re referencing the correct cells and that the data is accurate. Errors in your data will lead to incorrect CAGR calculations. Check for and eliminate potential division by zero errors, especially if the beginning value is zero.
Conclusion
Calculating CAGR in Excel is a straightforward process that provides valuable insights into the average growth rate of an investment over time. By following these steps and understanding the limitations of CAGR, you can effectively use this metric to evaluate investment performance and make informed financial decisions. Remember to always verify the accuracy of your data and be aware of the assumptions underlying the CAGR calculation.
 452×203 calculate compound annual growth rate cagr excel from trumpexcel.com
  800×600 calculate cagr excel steps pictures wikihow from www.wikihow.com
 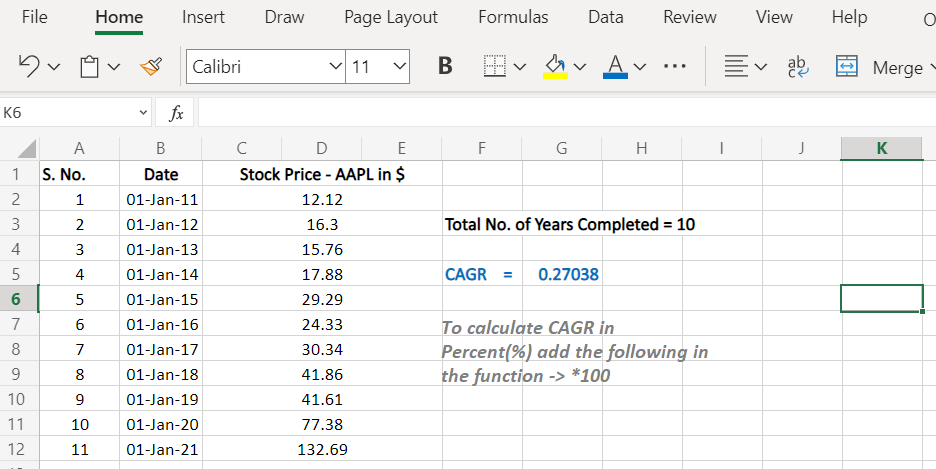 936×469 cagr excel calculate cagr excel quickexcel from quickexcel.com
  604×267 cagr formula excel step step tutorial from www.excel-easy.com
 How To Calculate CAGR In Excel Step By Step was posted in February 15, 2026 at 11:29 am. If you wanna have it as yours, please click the Pictures and you will go to click right mouse then Save Image As and Click Save and download the How To Calculate CAGR In Excel Step By Step Picture.. Don’t forget to share this picture with others via Facebook, Twitter, Pinterest or other social medias! we do hope you'll get inspired by ExcelKayra... Thanks again! If you have any DMCA issues on this post, please contact us!