How To Build A Forecast Model In Excel
How To Build A Forecast Model In Excel - There are a lot of affordable templates out there, but it can be easy to feel like a lot of the best cost a amount of money, require best special design template. Making the best template format choice is way to your template success. And if at this time you are looking for information and ideas regarding the How To Build A Forecast Model In Excel then, you are in the perfect place. Get this How To Build A Forecast Model In Excel for free here. We hope this post How To Build A Forecast Model In Excel inspired you and help you what you are looking for.
Building a Forecast Model in Excel
Excel, while not a dedicated statistical software package, offers powerful features for creating simple to moderately complex forecast models. This guide will walk you through several common forecasting techniques you can implement directly within Excel, providing a practical approach to predicting future values based on historical data.
Data Preparation is Key
Before diving into specific methods, ensuring your data is clean and properly formatted is crucial. This involves:
- Consistency: Ensure data points are recorded at consistent intervals (e.g., monthly, quarterly, annually). Inconsistent intervals require adjustments, possibly averaging or interpolation.
- Accuracy: Review your data for errors or outliers. Outliers can significantly skew your forecasts. Consider investigating and potentially adjusting or removing them if they are demonstrably errors.
- Formatting: Ensure your time series data is in a clear format, with dates or time periods in one column and corresponding values in another. This allows Excel to properly interpret the data’s temporal nature.
- Historical Data: The more historical data you have, the better your forecast is likely to be. Aim for at least 3-5 years of data to capture seasonality and trends.
Forecasting Methods in Excel
Here’s an overview of several popular forecasting methods you can use in Excel:
1. Moving Average
The moving average method smooths out fluctuations in the data by averaging values over a specific period. This is useful for identifying trends and filtering out random noise.
How to Implement:
- Determine the Period: Choose the number of periods (e.g., 3, 5, 7) to average. A shorter period is more sensitive to recent changes, while a longer period smooths the data more aggressively.
- Calculate the Average: Use the `AVERAGE` function in Excel. For example, if your data is in column B and you want a 3-period moving average, in cell C4, enter `=AVERAGE(B2:B4)`. This calculates the average of the first three data points.
- Drag Down: Drag the formula down the column to calculate the moving average for all subsequent periods.
- Forecast: The forecast for the next period is simply the last calculated moving average.
Limitations: Lags behind trends, doesn’t account for seasonality, and requires a defined period. It’s most effective for relatively stable data.
2. Exponential Smoothing
Exponential smoothing is a more sophisticated technique that assigns different weights to past data points. Recent data points are given more weight than older data points.
How to Implement:
- Choose a Smoothing Constant (Alpha): This value (between 0 and 1) determines the weight given to the most recent observation. A higher alpha makes the forecast more responsive to recent changes, while a lower alpha smooths the data more. A common starting point is 0.2 or 0.3.
- Initial Forecast: The forecast for the second period is usually set as the actual value of the first period.
- Smoothing Calculation: Use the following formula: `Forecast(t+1) = Alpha * Actual(t) + (1 – Alpha) * Forecast(t)`. In Excel, assuming your data is in column B, the initial forecast is in C2 (equal to B2), and alpha is in cell D1, the formula in C3 would be `=($D$1*B2) + ((1-$D$1)*C2)`. Note the use of `$` to fix the cell reference for Alpha.
- Drag Down: Drag the formula down the column to calculate the smoothed values for all subsequent periods.
- Forecast: The forecast for the next period is the last calculated smoothed value.
Variations: There are more advanced versions like Double Exponential Smoothing (for data with a trend) and Triple Exponential Smoothing (for data with both a trend and seasonality).
3. Linear Regression
Linear regression establishes a linear relationship between the time period (independent variable) and the data (dependent variable). This method is best suited for data with a clear linear trend.
How to Implement:
- Prepare Your Data: Assign numerical values to your time periods (e.g., 1, 2, 3…).
- Use the `FORECAST.LINEAR` Function: This function requires the x-value for the forecast, the known y-values (your data), and the known x-values (your time periods). The syntax is `=FORECAST.LINEAR(x, known_y’s, known_x’s)`. For example, if your data is in column B (B2:B10) and your time periods are in column A (A2:A10), and you want to forecast for period 11 (in cell A11), the formula would be `=FORECAST.LINEAR(A11,B2:B10,A2:A10)`.
- Alternatively: Use the `SLOPE` and `INTERCEPT` functions to calculate the linear regression equation (y = mx + b), and then use this equation to forecast future values.
Limitations: Assumes a linear relationship, doesn’t account for seasonality, and can be inaccurate if the trend is not truly linear.
4. Seasonal Adjustment (Descriptive Method)
If your data exhibits seasonality (e.g., sales peak every December), you can de-seasonalize the data before applying another forecasting method. This involves calculating seasonal indices and removing their effect from the original data.
How to Implement:
- Calculate Seasonal Averages: For each season (e.g., month), calculate the average value over all years.
- Calculate Overall Average: Calculate the average of all data points.
- Calculate Seasonal Indices: Divide each seasonal average by the overall average. These indices represent the proportion of the overall average that each season contributes.
- De-seasonalize the Data: Divide each data point by its corresponding seasonal index. This removes the seasonal effect.
- Forecast on De-seasonalized Data: Apply a forecasting method (e.g., moving average, exponential smoothing) to the de-seasonalized data.
- Re-seasonalize the Forecast: Multiply the forecast values by the corresponding seasonal indices to reintroduce the seasonality.
Evaluating Forecast Accuracy
It’s crucial to evaluate the accuracy of your forecast. Common metrics include:
- Mean Absolute Error (MAE): The average absolute difference between the forecast and actual values. Use the `ABS` and `AVERAGE` functions.
- Mean Squared Error (MSE): The average of the squared differences between the forecast and actual values. Use the `POWER` and `AVERAGE` functions.
- Root Mean Squared Error (RMSE): The square root of the MSE. Use the `SQRT` function.
Compare the accuracy of different forecasting methods and choose the one that performs best for your data.
Excel Functions to Know
Here’s a summary of key Excel functions for forecasting:
- `AVERAGE()`: Calculates the average of a range of cells.
- `FORECAST.LINEAR()`: Performs linear regression forecasting.
- `SLOPE()`: Calculates the slope of a linear regression line.
- `INTERCEPT()`: Calculates the y-intercept of a linear regression line.
- `EXP()`: Calculates the exponential of a number.
- `LN()`: Calculates the natural logarithm of a number.
- `ABS()`: Calculates the absolute value of a number.
- `POWER()`: Raises a number to a power.
- `SQRT()`: Calculates the square root of a number.
Conclusion
Building forecast models in Excel is a practical approach for simple to moderately complex forecasting tasks. By understanding different methods like moving averages, exponential smoothing, and linear regression, and by carefully preparing your data, you can leverage Excel’s functionality to generate useful predictions. Remember to evaluate the accuracy of your forecasts and choose the method that best suits your specific data and needs.
 738×428 forecast excel formula examples forecast function from www.educba.com
  602×440 excel forecast function training hub from www.myonlinetraininghub.com
 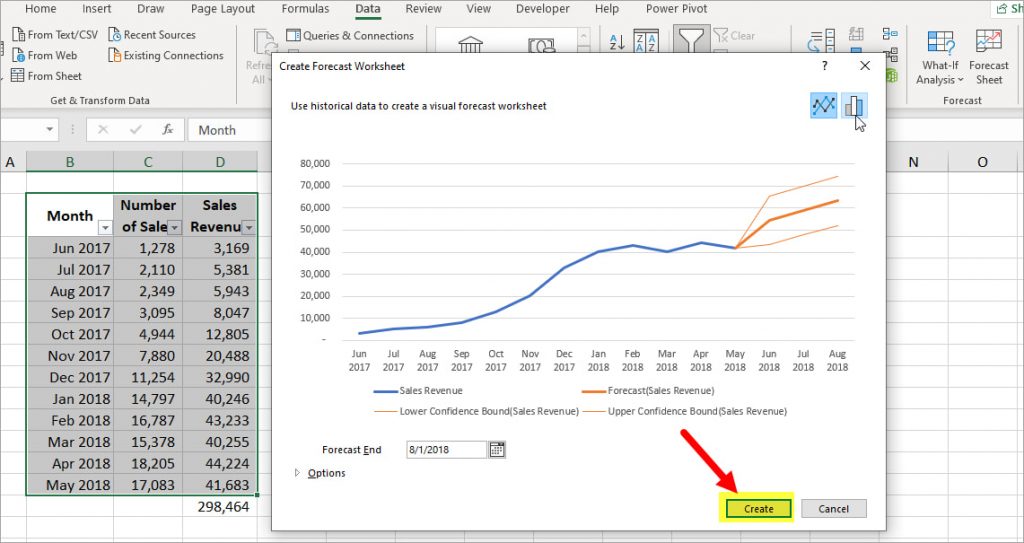 1024×543 forecast sheet excel video tutorial from yacostasolutions.com
  690×720 build forecast excel excel forecast function from www.analyticsvidhya.com
 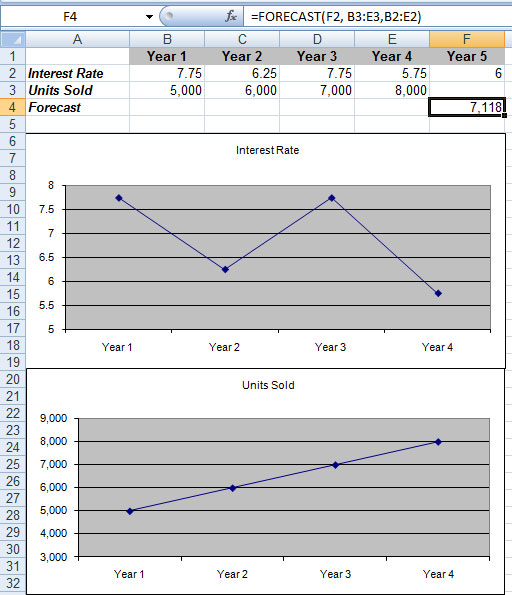 474×550 excels forecast function from www.inventoryops.com
  1080×675 build forecasting model excel tutorial corporate from www.privateequitymodels.com
 How To Build A Forecast Model In Excel was posted in July 21, 2025 at 9:27 am. If you wanna have it as yours, please click the Pictures and you will go to click right mouse then Save Image As and Click Save and download the How To Build A Forecast Model In Excel Picture.. Don’t forget to share this picture with others via Facebook, Twitter, Pinterest or other social medias! we do hope you'll get inspired by ExcelKayra... Thanks again! If you have any DMCA issues on this post, please contact us!