How To Create Monthly Income Statement In Excel
How To Create Monthly Income Statement In Excel - There are a lot of affordable templates out there, but it can be easy to feel like a lot of the best cost a amount of money, require best special design template. Making the best template format choice is way to your template success. And if at this time you are looking for information and ideas regarding the How To Create Monthly Income Statement In Excel then, you are in the perfect place. Get this How To Create Monthly Income Statement In Excel for free here. We hope this post How To Create Monthly Income Statement In Excel inspired you and help you what you are looking for.
Creating a Monthly Income Statement in Excel
An income statement, also known as a profit and loss (P&L) statement, summarizes a company’s financial performance over a period of time. Creating a monthly income statement in Excel is a valuable tool for tracking your business’s profitability, identifying trends, and making informed decisions. This guide will walk you through the process step-by-step.
1. Setting Up Your Excel Worksheet
First, open Excel and create a new workbook. Rename the first sheet “Income Statement.” This will be your primary workspace.
Column Headers
Establish your column headers. You’ll typically need the following:
- Description: This column will describe each line item (e.g., Sales Revenue, Cost of Goods Sold).
- Month 1 (e.g., January): This will be the column for the first month’s data. Rename it with the actual month name.
- Month 2 (e.g., February): This column will be for the second month’s data. Rename it accordingly.
- Month 3 (e.g., March): Continue adding columns for all the months you want to include.
- Year-to-Date (YTD): This column will calculate the cumulative total for each line item from the beginning of the year to the current month.
Widen the “Description” column to accommodate longer text. Adjust the width of the month columns for optimal readability of your numbers.
2. Defining Your Income Statement Structure
An income statement generally follows a standard format. Here’s the typical structure you’ll implement in your Excel sheet:
Revenue
- Sales Revenue: The total income generated from selling your products or services. This is your top line.
- Other Revenue: Income from sources other than your primary business activity (e.g., interest income, rental income). This may not always be applicable.
Cost of Goods Sold (COGS)
- Direct Materials: The cost of raw materials used in producing your products.
- Direct Labor: The wages paid to employees directly involved in production.
- Manufacturing Overhead: All other costs associated with production (e.g., factory rent, utilities, depreciation of manufacturing equipment).
Gross Profit
Gross profit is calculated by subtracting COGS from Revenue. This indicates the profitability of your core business operations.
Operating Expenses
- Salaries and Wages: The cost of employees not directly involved in production (e.g., sales, marketing, administrative staff).
- Rent Expense: The cost of renting office space or other facilities.
- Utilities Expense: The cost of electricity, gas, water, etc.
- Marketing and Advertising Expense: The cost of promoting your products or services.
- Depreciation Expense: The allocation of the cost of assets (e.g., equipment, vehicles) over their useful life.
- Insurance Expense: The cost of insurance premiums.
- Office Supplies Expense: The cost of office-related materials.
- Travel Expense: The cost of business travel.
Operating Income (EBIT)
Operating income, also known as Earnings Before Interest and Taxes (EBIT), is calculated by subtracting Operating Expenses from Gross Profit. This represents the profitability of your operations before considering financing costs and taxes.
Interest Expense
- Interest Expense: The cost of borrowing money (e.g., interest on loans).
Income Before Taxes
Income Before Taxes is calculated by subtracting Interest Expense from Operating Income.
Income Tax Expense
- Income Tax Expense: The estimated amount of income taxes owed.
Net Income
Net Income is calculated by subtracting Income Tax Expense from Income Before Taxes. This is your bottom line – your company’s profit after all expenses and taxes.
3. Entering Your Data
Now it’s time to populate your Excel sheet with actual financial data. For each line item, enter the corresponding figures for each month. Ensure the data is accurate and consistent. Double-check your sources (e.g., accounting software, bank statements, invoices).
4. Using Formulas for Calculations
Excel’s power lies in its formulas. Use formulas to automate calculations and ensure accuracy.
Gross Profit Formula
In the row for Gross Profit, in the January column (assuming January is column B and Sales Revenue is in row 3 and COGS is in row 6), enter the following formula: =B3-B6. Copy this formula across all the month columns.
Operating Income (EBIT) Formula
In the row for Operating Income, in the January column (assuming January is column B, Gross Profit is in row 8, and the first Operating Expense, Salaries, is in row 10), and your last operating expense is in row 17, use the following formula: =B8-SUM(B10:B17). Copy this formula across all the month columns.
Income Before Taxes Formula
In the row for Income Before Taxes, in the January column (assuming January is column B, Operating Income is in row 19, and Interest Expense is in row 21), enter the following formula: =B19-B21. Copy this formula across all the month columns.
Net Income Formula
In the row for Net Income, in the January column (assuming January is column B, Income Before Taxes is in row 23, and Income Tax Expense is in row 25), enter the following formula: =B23-B25. Copy this formula across all the month columns.
Year-to-Date (YTD) Formula
For the YTD column, you’ll use the SUM function. For example, if your data starts in column B (January) and ends in column D (March), and Sales Revenue is in row 3, the YTD formula in column E (YTD column) for Sales Revenue would be: =SUM(B3:D3). Copy this formula down for all line items. As you add more months, adjust the range in the SUM formula to include all months to date.
5. Formatting Your Income Statement
Proper formatting enhances readability and professionalism.
- Currency Formatting: Select all the cells containing monetary values and apply currency formatting (e.g., $#,##0.00).
- Number Formatting: For cells that aren’t currency, use number formatting with commas for thousands separators (e.g., #,##0).
- Bolding: Use bold font for headings (Revenue, COGS, Gross Profit, etc.) and totals (Gross Profit, Operating Income, Net Income).
- Borders: Add borders to separate sections and create a clean look.
- Alignment: Align column headers to the center and data to the right for better visual clarity.
- Subtotals: Clearly identify subtotal rows using formatting (e.g., underlining, different background color).
6. Customizing Your Income Statement
Tailor your income statement to your specific business needs.
- Add More Detail: Break down line items into more granular categories. For example, you could break down Sales Revenue by product line or customer segment.
- Include Percentages: Add columns to calculate percentages of revenue. For example, calculate COGS as a percentage of Sales Revenue to track cost efficiency. The formula would be =(B6/B3)*100, and formatted as a percentage.
- Conditional Formatting: Use conditional formatting to highlight trends or anomalies. For example, highlight months where expenses exceed a certain threshold.
- Charts and Graphs: Create charts and graphs to visualize your income statement data. This can help you quickly identify trends and patterns.
7. Saving and Protecting Your Worksheet
Save your Excel workbook regularly. Consider password-protecting your worksheet to prevent unauthorized access or modifications.
8. Review and Analysis
The most important step is to review and analyze your monthly income statement. Look for trends, identify areas for improvement, and use the information to make informed business decisions. Compare your results month to month and year over year. Ask questions like: Are your sales increasing or decreasing? Are your expenses under control? What is your net profit margin?
Example Structure:
| Description | January | February | March | YTD |
|---|---|---|---|---|
| Sales Revenue | ||||
| Cost of Goods Sold | ||||
| Gross Profit | ||||
| Salaries and Wages | ||||
| Rent Expense | ||||
| Utilities Expense | ||||
| Operating Income (EBIT) | ||||
| Interest Expense | ||||
| Income Before Taxes | ||||
| Income Tax Expense | ||||
| Net Income |
By following these steps, you can create a powerful and informative monthly income statement in Excel to help you manage and grow your business.
 1205×429 monthly income statement excel db excelcom from db-excel.com
 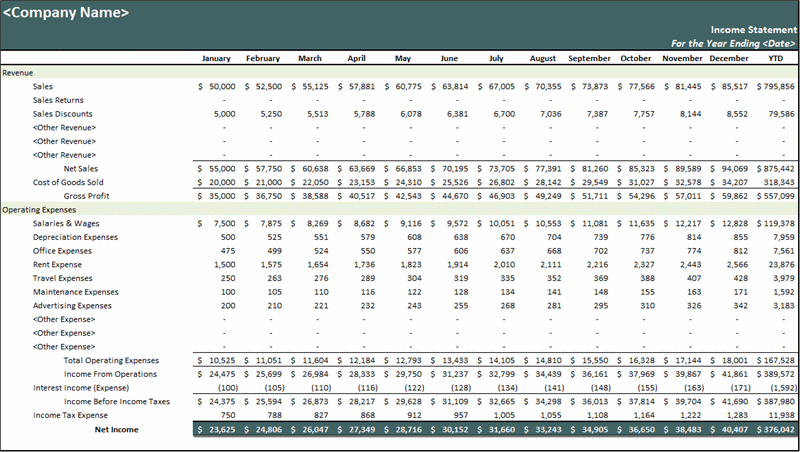 800×452 monthly income statement db excelcom from db-excel.com
 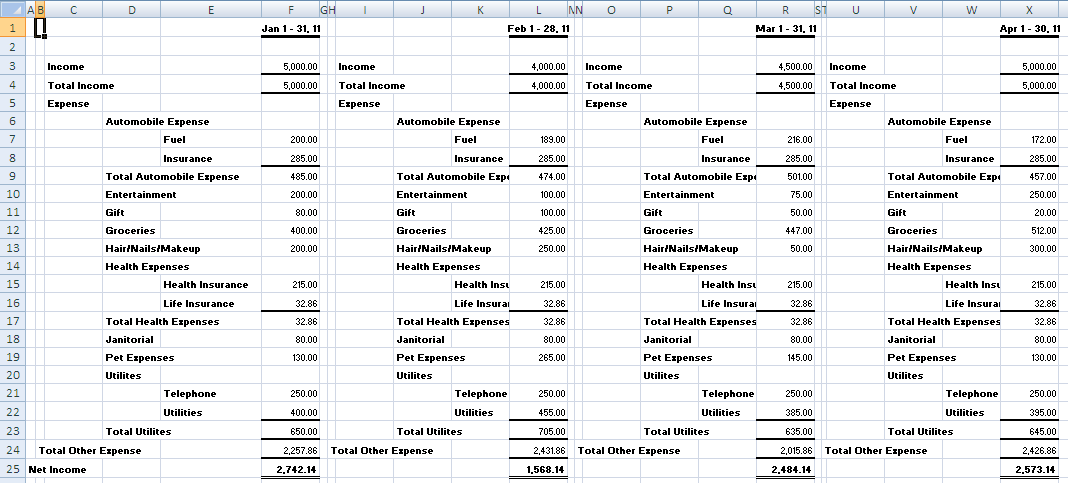 1068×483 monthly income statement format excel db excelcom from db-excel.com
  1313×458 monthly income statement monthly spreadsheet income spreadsheet income from excelxo.com
  1650×1275 monthly income statement income statement template monthly spreadsheet from excelxo.com
  252×223 monthly income statement template excel templates from www.exceltemplates.com
  585×680 monthly income statement template excel doctemplates from doctemplates.us
 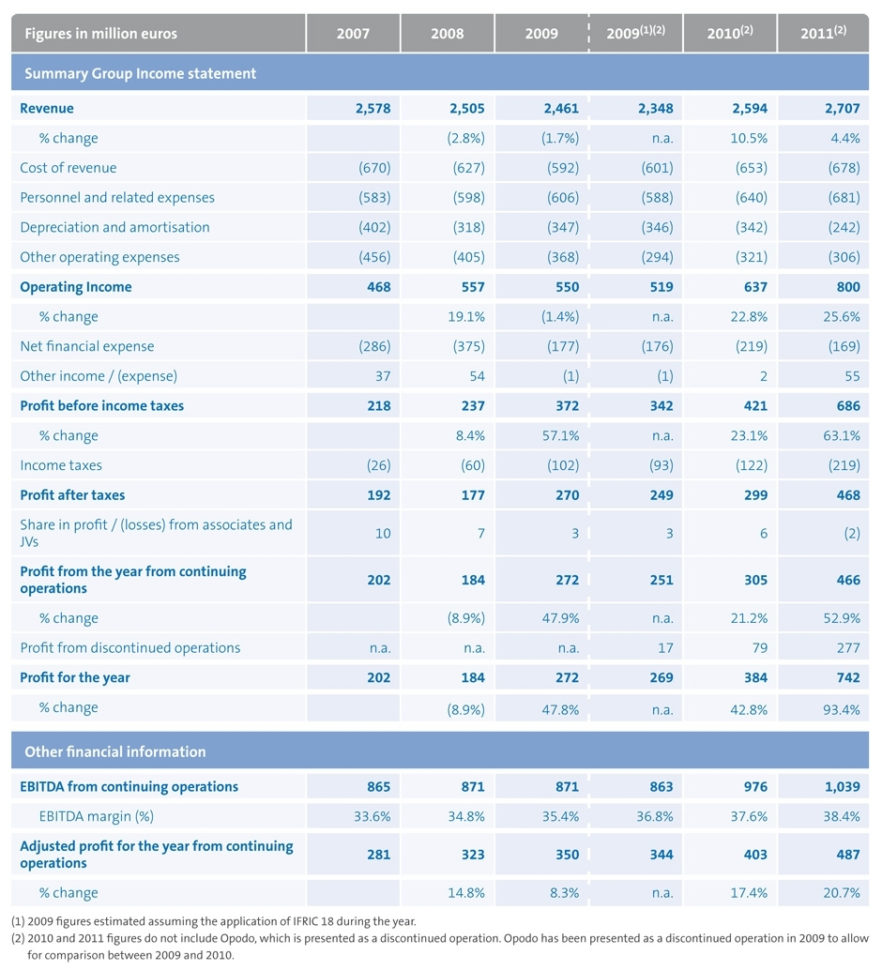 882×970 income statement template excel db excelcom from db-excel.com
  1728×1350 monthly income statement template excel excel templates from www.exceltemplate123.us
  1024×788 monthly income statement template excel template from enterstarcrypticcity.blogspot.com
 How To Create Monthly Income Statement In Excel was posted in October 21, 2025 at 1:12 pm. If you wanna have it as yours, please click the Pictures and you will go to click right mouse then Save Image As and Click Save and download the How To Create Monthly Income Statement In Excel Picture.. Don’t forget to share this picture with others via Facebook, Twitter, Pinterest or other social medias! we do hope you'll get inspired by ExcelKayra... Thanks again! If you have any DMCA issues on this post, please contact us!