How To Calculate CAGR In Excel For Investment Growth
How To Calculate CAGR In Excel For Investment Growth - There are a lot of affordable templates out there, but it can be easy to feel like a lot of the best cost a amount of money, require best special design template. Making the best template format choice is way to your template success. And if at this time you are looking for information and ideas regarding the How To Calculate CAGR In Excel For Investment Growth then, you are in the perfect place. Get this How To Calculate CAGR In Excel For Investment Growth for free here. We hope this post How To Calculate CAGR In Excel For Investment Growth inspired you and help you what you are looking for.
“`html
Calculating CAGR in Excel: A Comprehensive Guide
The Compound Annual Growth Rate (CAGR) is a vital metric for evaluating the performance of investments over a specific period. Unlike simple average returns, CAGR accounts for the effects of compounding, providing a more accurate representation of growth. It essentially shows the steady annual rate at which an investment would have grown if it had grown at a constant rate.
Understanding CAGR
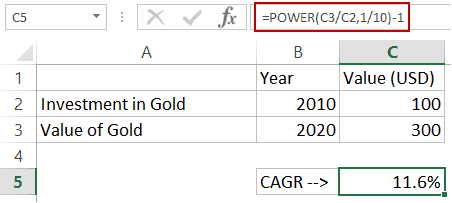
Before diving into Excel, let’s clarify the concept. CAGR is calculated using the following formula:
CAGR = (Ending Value / Beginning Value)^(1 / Number of Years) – 1
Where:
- Ending Value: The value of the investment at the end of the period.
- Beginning Value: The value of the investment at the start of the period.
- Number of Years: The length of the investment period.
The result is a decimal, which is then multiplied by 100 to express it as a percentage.
Calculating CAGR in Excel: Step-by-Step
Here’s a step-by-step guide on how to calculate CAGR in Excel using different scenarios, complete with examples.
Scenario 1: Basic CAGR Calculation
Let’s say you invested $10,000 five years ago, and it’s now worth $16,105.10. Here’s how to calculate the CAGR:
- Open Excel: Start a new Excel spreadsheet.
- Enter Data: In separate cells, enter the following:
- Cell A1: Beginning Value (e.g., 10000)
- Cell A2: Ending Value (e.g., 16105.10)
- Cell A3: Number of Years (e.g., 5)
- Enter the Formula: In another cell (e.g., A4), enter the CAGR formula using cell references:
=((A2/A1)^(1/A3))-1
- Format as Percentage: Select the cell containing the formula (A4 in our example). Go to the “Home” tab, and in the “Number” group, click the percentage symbol (%). You can also adjust the decimal places to your preference.
Excel will calculate the CAGR, which should be approximately 10.00% in this example.
Scenario 2: Calculating CAGR with a Table of Investment Values
Often, you’ll have a table of investment values over multiple years. Let’s say you have annual closing values from 2018 to 2023:
| Year | Value |
|---|---|
| 2018 | $5,000 |
| 2019 | $5,500 |
| 2020 | $6,050 |
| 2021 | $6,655 |
| 2022 | $7,320.50 |
| 2023 | $8,052.55 |
- Enter Data: Input the data into an Excel sheet:
- Column A: Years (2018, 2019, 2020, 2021, 2022, 2023)
- Column B: Value (5000, 5500, 6050, 6655, 7320.50, 8052.55)
- Identify Beginning and Ending Values: Determine the beginning value (B2 in this case, corresponding to 2018) and the ending value (B7 in this case, corresponding to 2023).
- Calculate the Number of Years: Subtract the starting year from the ending year (2023 – 2018 = 5 years). Alternatively, you could use `=COUNT(A2:A7) – 1` to count the number of years minus one, for cases where the table is very long.
- Enter the Formula: In a separate cell (e.g., C2), enter the CAGR formula using the cell references:
=((B7/B2)^(1/(A7-A2)))-1
or
=((B7/B2)^(1/(COUNT(A2:A7)-1)))-1
- Format as Percentage: Format the cell as a percentage.
The calculated CAGR will be approximately 10.00%.
Scenario 3: Dealing with Missing Years or Incomplete Data
Sometimes, you might have missing data for certain years. The CAGR formula still works, but you need to ensure the “Number of Years” accurately reflects the total investment period, not the number of data points.
For example, imagine you have the following data:
| Year | Value |
|---|---|
| 2018 | $10,000 |
| 2020 | $12,100 |
| 2022 | $14,641 |
- Enter Data: Input the data into Excel.
- Identify Beginning and Ending Values: B2 and B4 represent beginning and ending values, respectively.
- Determine the Number of Years: The investment period is from 2018 to 2022, which is 4 years (2022 – 2018 = 4). Even though there are only three data points, the investment spanned four years.
- Enter the Formula: In a cell (e.g., C2), enter:
=((B4/B2)^(1/(A4-A2)))-1
- Format as Percentage: Format as a percentage.
The calculated CAGR will be approximately 10.00%.
Scenario 4: Handling Negative Values (Losses)
The CAGR formula works even if your investment experiences losses (negative values). Let’s say you started with $20,000, and after three years, it’s worth $15,000.
- Enter Data:
- Beginning Value: 20000
- Ending Value: 15000
- Number of Years: 3
- Enter the Formula: Use the standard CAGR formula:
=((B2/B1)^(1/B3))-1
- Format as Percentage: Format the cell as a percentage.
The resulting CAGR will be negative, indicating a loss. In this example, it’s approximately -9.56%.
Important Considerations
- CAGR is a Smoothed Rate: CAGR represents a smoothed, annualized rate. It doesn’t reflect the actual year-to-year volatility of the investment. In reality, investments rarely grow at a perfectly consistent rate.
- Limited Scope: CAGR only considers the beginning and ending values. It ignores any deposits or withdrawals made during the investment period. If you make contributions or withdrawals, the CAGR will not accurately reflect your investment’s performance. In those cases, consider using metrics like Time-Weighted Rate of Return (TWRR).
- Comparison Tool: CAGR is best used for comparing the performance of different investments over the same period, or for comparing the performance of the same investment over different periods.
Beyond the Basics: Power BI
While Excel is great for basic CAGR calculations, tools like Power BI can offer more advanced visualizations and analysis, especially when dealing with large datasets and complex investment scenarios. Power BI allows you to create dynamic dashboards to track your investments and calculate CAGR automatically.
Conclusion
Calculating CAGR in Excel is a straightforward process that provides valuable insights into investment performance. By understanding the formula and following these step-by-step instructions, you can accurately measure and compare the growth rates of your investments. Remember to consider the limitations of CAGR and use it in conjunction with other performance metrics for a comprehensive evaluation.
“`
 452×203 calculate compound annual growth rate cagr excel from trumpexcel.com
  617×175 calculate cagr compound annual growth rate excel scott ackerman from sackermanconsulting.com
  936×469 cagr excel calculate cagr excel quickexcel from quickexcel.com
  604×267 cagr formula excel step step tutorial from www.excel-easy.com
  469×194 calculate cagr compounded annual growth rate excel formulas from chandoo.org
  500×170 calculate cagr excel compound annual growth rate formula from www.tech-recipes.com
  549×338 calculate compound annual growth rate cagr microsoft excel from www.exceltip.com
  426×310 calculate compound annual growth rate cagr microsoft from www.exceltip.com
  537×244 calculate cagr excel from cagrcalculator.net
  420×262 cagr formula excel examples cagr formula from www.educba.com
  515×161 experts exploring multibagger small mid cap stocks hidden gems from www.saralgyan.in
 How To Calculate CAGR In Excel For Investment Growth was posted in November 20, 2025 at 8:06 am. If you wanna have it as yours, please click the Pictures and you will go to click right mouse then Save Image As and Click Save and download the How To Calculate CAGR In Excel For Investment Growth Picture.. Don’t forget to share this picture with others via Facebook, Twitter, Pinterest or other social medias! we do hope you'll get inspired by ExcelKayra... Thanks again! If you have any DMCA issues on this post, please contact us!