How To Calculate Break-even Analysis In Excel
How To Calculate Break-even Analysis In Excel - There are a lot of affordable templates out there, but it can be easy to feel like a lot of the best cost a amount of money, require best special design template. Making the best template format choice is way to your template success. And if at this time you are looking for information and ideas regarding the How To Calculate Break-even Analysis In Excel then, you are in the perfect place. Get this How To Calculate Break-even Analysis In Excel for free here. We hope this post How To Calculate Break-even Analysis In Excel inspired you and help you what you are looking for.
Break-even analysis is a crucial financial tool used to determine the point at which total revenue equals total costs. In other words, it identifies the sales volume needed to cover all expenses, resulting in neither profit nor loss. Understanding the break-even point is essential for pricing decisions, budgeting, and assessing the viability of a business or project. Microsoft Excel provides a user-friendly environment for performing break-even analysis. This guide will walk you through the process, demonstrating how to calculate break-even point using formulas and goal seek.
Understanding the Components
Before diving into Excel, let’s define the key components of break-even analysis:
- Fixed Costs: These are expenses that remain constant regardless of the production or sales volume. Examples include rent, salaries, insurance, and depreciation.
- Variable Costs: These costs fluctuate directly with the level of production or sales. Examples include raw materials, direct labor, and sales commissions.
- Selling Price per Unit: The price at which each unit of the product or service is sold.
- Contribution Margin per Unit: This is the difference between the selling price per unit and the variable cost per unit. It represents the amount each unit contributes towards covering fixed costs and generating profit.
- Break-Even Point (Units): The number of units that must be sold to cover all fixed and variable costs.
- Break-Even Point (Sales Revenue): The total revenue needed to cover all fixed and variable costs.
Calculating Break-Even Point in Units
The formula for calculating the break-even point in units is:
Break-Even Point (Units) = Fixed Costs / (Selling Price per Unit – Variable Cost per Unit)
Let’s illustrate this with an example in Excel:
- Set up your Excel spreadsheet:
- In cell A1, enter “Fixed Costs:”.
- In cell A2, enter “Selling Price per Unit:”.
- In cell A3, enter “Variable Cost per Unit:”.
- In cell A4, enter “Break-Even Point (Units):”.
- Enter your data:
- In cell B1, enter your fixed costs. For example, let’s say your fixed costs are $50,000. So, enter 50000.
- In cell B2, enter your selling price per unit. Let’s say your selling price is $25 per unit. So, enter 25.
- In cell B3, enter your variable cost per unit. Let’s say your variable cost is $15 per unit. So, enter 15.
- Calculate the Break-Even Point (Units):
- In cell B4, enter the following formula: `=B1/(B2-B3)`
- Press Enter. Excel will automatically calculate the break-even point in units. In this example, the result would be 5,000 units.
Therefore, you need to sell 5,000 units to cover all your fixed and variable costs.
Calculating Break-Even Point in Sales Revenue
The formula for calculating the break-even point in sales revenue is:
Break-Even Point (Sales Revenue) = Fixed Costs / ((Selling Price per Unit – Variable Cost per Unit) / Selling Price per Unit)
Or, more simply, you can use the break-even point in units calculated previously:
Break-Even Point (Sales Revenue) = Break-Even Point (Units) * Selling Price per Unit
Continuing with our example in Excel:
- Add a label for Sales Revenue:
- In cell A5, enter “Break-Even Point (Sales Revenue):”.
- Calculate the Break-Even Point (Sales Revenue):
- In cell B5, enter the following formula: `=B4*B2`
- Press Enter. Excel will calculate the break-even point in sales revenue. In this example, the result would be $125,000.
Therefore, you need to generate $125,000 in sales revenue to cover all your fixed and variable costs.
Using Goal Seek for Break-Even Analysis
Excel’s Goal Seek feature offers another method for performing break-even analysis. Goal Seek allows you to determine what value is needed in one cell to achieve a desired result in another cell. This is particularly useful if you want to determine the sales volume needed to achieve a specific profit target, including zero profit (the break-even point).
Here’s how to use Goal Seek to find the break-even point in units:
- Set up your Excel spreadsheet (Similar to before, but with a Profit Calculation):
- In cell A1, enter “Fixed Costs:”.
- In cell A2, enter “Selling Price per Unit:”.
- In cell A3, enter “Variable Cost per Unit:”.
- In cell A4, enter “Sales Volume (Units):”. This is the cell we want to find.
- In cell A5, enter “Total Revenue:”.
- In cell A6, enter “Total Costs:”.
- In cell A7, enter “Profit:”.
- Enter your known data (Same as before):
- In cell B1, enter your fixed costs: 50000.
- In cell B2, enter your selling price per unit: 25.
- In cell B3, enter your variable cost per unit: 15.
- Leave cell B4 (Sales Volume) blank for now. This is what Goal Seek will determine.
- Enter the Formulas:
- In cell B5 (Total Revenue), enter the formula: `=B4*B2` (Sales Volume * Selling Price).
- In cell B6 (Total Costs), enter the formula: `=B1+(B4*B3)` (Fixed Costs + (Sales Volume * Variable Cost)).
- In cell B7 (Profit), enter the formula: `=B5-B6` (Total Revenue – Total Costs).
- Use Goal Seek:
- Go to the “Data” tab on the Excel ribbon.
- In the “Forecast” group, click “What-If Analysis” and then select “Goal Seek…”.
- In the Goal Seek dialog box:
- Set cell: Enter cell B7 (the profit cell).
- To value: Enter 0 (because we want to find the break-even point, where profit is zero).
- By changing cell: Enter cell B4 (the sales volume cell, which we want to find).
- Click “OK”. Excel will run Goal Seek and automatically adjust the value in cell B4 (Sales Volume) until the value in cell B7 (Profit) is zero.
- Click “OK” again to accept the solution.
The value in cell B4 will now display the break-even point in units (which should be 5,000 in our example).
Sensitivity Analysis
Break-even analysis relies on several assumptions, such as constant fixed costs, consistent variable costs, and a stable selling price. However, these factors can fluctuate in reality. Sensitivity analysis helps you understand how changes in these variables affect the break-even point.
You can perform sensitivity analysis by creating scenarios in Excel. For example, you can create scenarios where:
- Fixed costs increase by 10%.
- The selling price decreases by 5%.
- Variable costs increase by 8%.
By recalculating the break-even point for each scenario, you can assess the impact of these changes and identify potential risks.
Conclusion
Break-even analysis is a powerful tool that provides valuable insights into the financial viability of a business. Excel simplifies the process of calculating the break-even point, allowing you to quickly assess different scenarios and make informed decisions. By understanding the underlying formulas and utilizing Excel’s features like Goal Seek, you can effectively manage costs, set appropriate prices, and improve profitability.
 952×557 break analysis excel break analysis template from myexceltemplates.com
  817×501 break analysis excel template excel tmp from exceltmp.com
  474×264 break analysis excel from www.extendoffice.com
 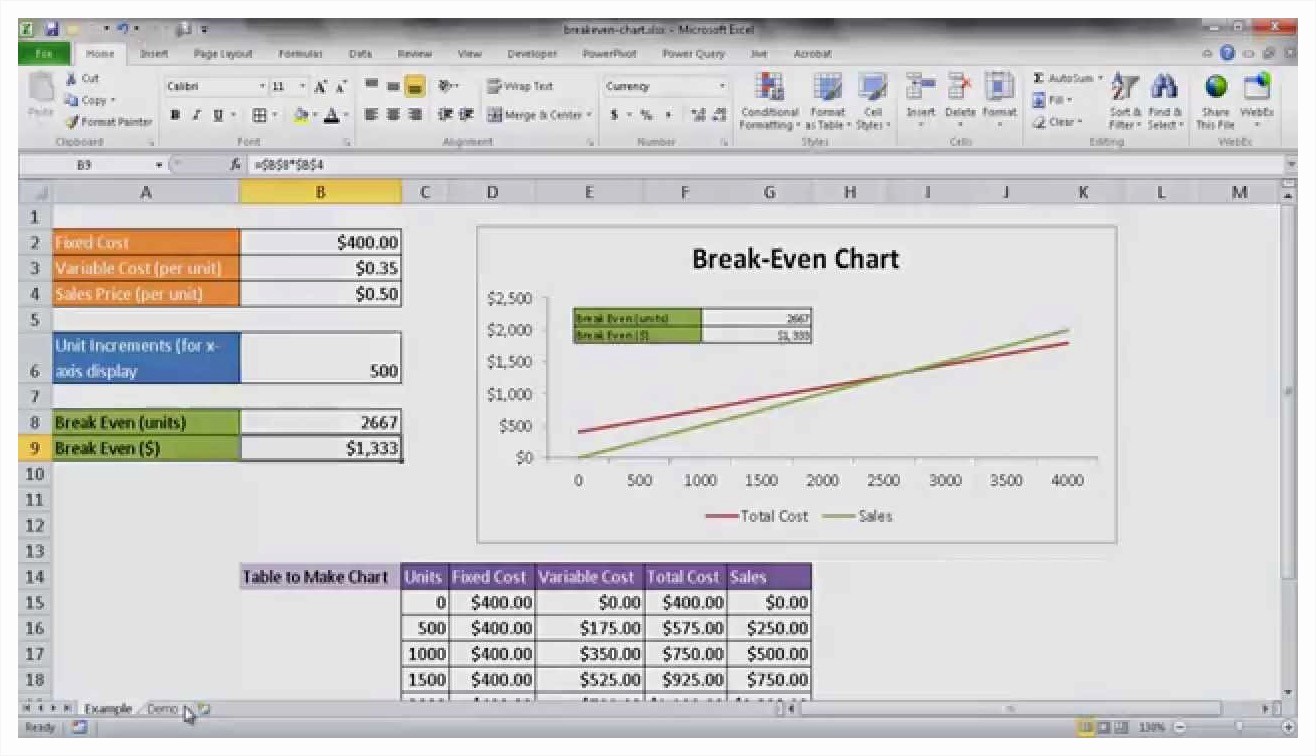 1316×756 break analysis formula excel from ufreeonline.net
  951×472 create break analysis chart excel chris menard chris from chrismenardtraining.com
  817×1057 break analysis excel templates allbusinesstemplatescom from www.allbusinesstemplates.com
  1293×970 break spreadsheet break chart excel from db-excel.com
  854×725 break analysis template excel data driven charts from www.free-power-point-templates.com
 How To Calculate Break-even Analysis In Excel was posted in November 13, 2025 at 3:14 am. If you wanna have it as yours, please click the Pictures and you will go to click right mouse then Save Image As and Click Save and download the How To Calculate Break-even Analysis In Excel Picture.. Don’t forget to share this picture with others via Facebook, Twitter, Pinterest or other social medias! we do hope you'll get inspired by ExcelKayra... Thanks again! If you have any DMCA issues on this post, please contact us!